Annotated Bibliography
Problem Statement
Third world countries present the highest rate of infectious disease spread, and there is also a lack of data surrounding human movement. The goal is develop a cost-effective and accurate solution to pinpoint locations that are either the source of the disease or susceptible to the disease so that adequate and timely aid can be directed to such areas. WIth the rise of mobile phone communication, there is ample real-time data on human movement in these third world countries. The solution proposed is a machine learning model which utilizes CDR data to predict disease dynamics and where the next outbreak would be to direct aid in advance to prevent the spread and transmission of disease.
Source 1: Connecting Mobility to Infectious Diseases: The Promise and Limits of Mobile Phone Data
Wesolowski Amy, Buckee Caroline O., Engø-Monsen Kenth, Metcalf C. J. E. Connecting Mobility to Infectious Diseases: The Promise and Limits of Mobile Phone Data. Journal of Infectious Diseases. 2016;214(suppl 4):S414–S420. doi: 10.1093/infdis/jiw273.
Disease is spread when human migration and movement introduces new pathogens to susceptible populations. As movement increases, more contact is made with susceptible and infected persons. Before CDR and mobile phone data, tracking human movement in real time was a difficult feat. Prediction models and maps were based off of simplistic assumptions about human movement and interactions because there was no other way to efficiently monitor them. CDR (Call Detail Record) data ameliorates this problem by making data on human movement much more available, especially in third-world countries where disease epidemic is high. Currently, 39% of the population in Sub-Saharan Africa owns a mobile phone, and this number is increasing rapidly. The way that CDR data is created by listing the closes cell tower the phone interaction was made from which gives a location estimate for the individual, as well as the code for the SIM card of the user. One difficulty that CDR data poses is the lack of openly available data because companies do not want to give up their information easily because they have to take into account privacy concerns. To remedy this issue, much of the CDR data being used is anonymous so that the information cannot be tracked back to specific individuals. Another difficulty is with biases in terms of who owns phones, the calling behavior of individuals, tower density within a specific area, and how many SIM cards individuals own. Although the data is not perfect, currently, it is the best way to model human movement both quickly and accurately.
The models that use CDR data simulate patterns of disease spread through space and time with individual human movements and knowledge of the biological disease. Some difficulties that the models propose are a lack of validation, parameter sensitivity, and error propagation. The authors concluded that the best way to address these issues would be through aggregation of the models.
The authors studied multiple disease dynamics, one of these diseases being malaria. For malaria, disease data was derived from parasite prevalence maps that were used in conjunction with information on travel between settlements to understand the flow of malaria parasites. Some of the goals based on the malaria studies were to identify the locations at risk of outbreak and the locations where the disease originated. This research has been expanded to malaria, dengue, ebola, HIV, and cholera.
This paper shows that mobile phone data has the power to quantify human movements and relate these population dynamics to the spread of infectious diseases in third-world countries where disease epidemics are high, and available data is low.
Source 2: Predicting Infectious Disease Using Deep Learning and Big Data
Chae, Sangwon & Kwon, Sungjun & Lee, Donghyun. (2018). Predicting Infectious Disease Using Deep Learning and Big Data. International Journal of Environmental Research and Public Health. 15. 1596. 10.3390/ijerph15081596.
This article compares different Machine Learning and statistical prediction models against one another in predicting disease dynamics. The study was conducted in South Korea by the KCDC. The article proposed two novel ideas that I would like to utilize in my solution model: using mobile phone data and machine learning models to predict disease spread one week in advance. The authors compare the commonly used ARIMA (Autoregressive Integrated Moving Average) model and OLS (Ordinary Least Squares) model to ten different LSTM (Long-Short Term Memory) models and ten different DNN (Deep Neural Network) models.
A data-based infection disease prediction model is beneficial because it can handle situations in real time, where as the current statistical based methods have delays in reporting. In previous studies, twitter data has been used to monitor occurences of mental illness, and in this study it is being used to model infectious disease. Along with mobile phone data, the authors used weather, rainfall, humidity data, temperature, and query data. The authors used Keras — a high-level open source neural network API for python — to build the machine learning models.
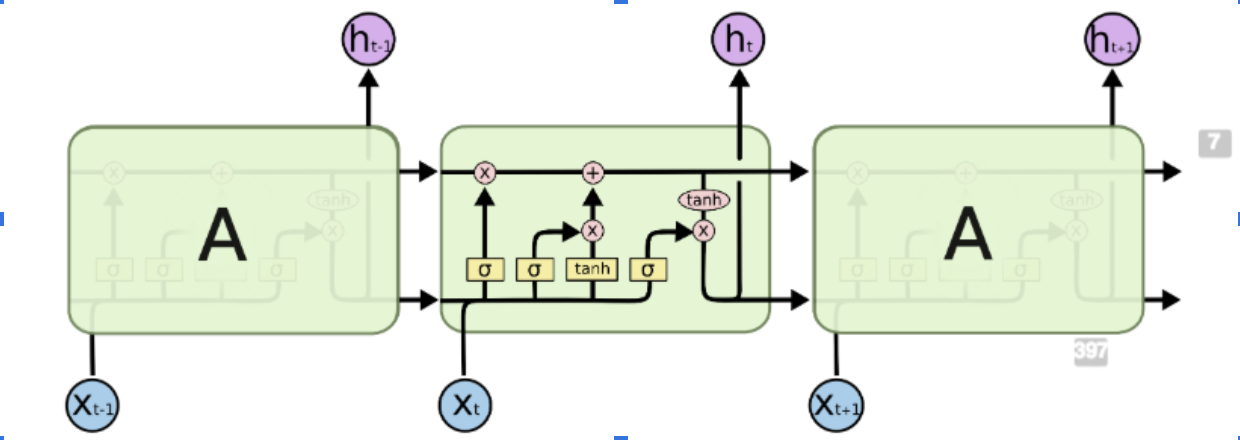
Deep learning neural networks are a more advanced version of neural networks because they contain many hidden layers, whereas neural networks only contain one, along with the input and output layer. LSTMs are a more advanced subset of RNNs (Recurrent Neural Networks). Recurrent Neural Networks are generally used for sequential data. The most common uses for RNNs are making predictions within text, but in this case, the RNN is being used to make predictions over space and time. One pitfall of RNNs is their inability to maintain information/context over time, and that’s why LSTMs are being used instead. LSTMs contain a forget gate layer which either outputs a 0 or 1 after each iteration which is used to represent which information should be kept for context in the future and which information should be forgotten. LSTMs prevent gradient loss over time which is useful for this situation where context and information must be maintained over longer periods of time.
When creating the different models, only two parameters — the optimizer and the dropout — of the DNN were changed. The optimizer is used to change the attributes, such as the weights or the learning rate, of the neural network in order to minimize losses. The dropout is a machine learning technique in which some data is ignored during training to increase the robustness of a model and prevent overfitting.
The conclusions showed that the DNN performed the most stably with a 24% performance improvement over the ARIMA model. The LSTM also did much better than the traditional ARIMA model with a 19% performance improvement. The DNN models performed best on average, but the LSTMs proved to be more accurate when infectious diseases were spreading.
This paper offers solutions to which machine learning models would be best to approach infectious disease dynamics. This used mobile phone data from social media, but CDR data has the potential to improve the models’ predicting abilities.
Source 3: Assessing the interplay between human mobility and mosquito borne diseases in urban environments
Massaro, E., Kondor, D. & Ratti, C. Assessing the interplay between human mobility and mosquito borne diseases in urban environments. Sci Rep 9, 16911 (2019). https://doi.org/10.1038/s41598-019-53127-z
This article studies the interplay between human mobility and dengue outbreaks in Singapore. Human mobility leads to humans moving to non-infected areas and giving non-infected mosquitoes the virus. This is how a vector-borne virus such as dengue or malaria is spread. More than 50 million people are infected with dengue per year, and over half the world’s population is at risk of infection. Every year dengue leads to half a million hospitalizations and over 25,000 deaths. The authors suggest that an agent-based transmission model is used to predict disease outbreaks. In this model, humans and mosquitoes are represented as agents that go through the epidemic states of dengue. This article is slightly different than others because it is tackling infectious disease spread in urban environments as opposed to third world countries. Rapid urbanization in certain areas has led to increase outbreaks in big cities. The two major outbreaks studied were in Singapore in 2013 and 2014. Poor housing conditions and widespread poverty exacerbate the impact of infectious diseases in city environments.
The authors focus on comparing random mobility models that lead to perfect mixing in the population with more structured mobility models. This allows them to evaluate the importance of intra-city human mobility in dengue spread. Dengue dynamics are modeled by using a stochastic population model based on the ordinary differential equation model. The city is viewed by overlaying a 320x320m cell grid over the city. Each model is composed of two phases: the reaction and diffusion phases. The reaction phase is where disease transmission takes place in each cell and the diffusion phase is where agents are moved from one grid cell to another. Each phase consists of two parts: the reaction phase is split into day and night and the diffusion phase is split into people’s morning and evening commute.
The authors tested four different models: mobile phone data-based model, random work locations, Levy-distribution model, and radiation model. The mobile phone data model estimated the home and work locations of the individuals using CDR data. The random model estimated home cells by mobile phone data but work locations were assigned randomly. The levy-distribution assigns each agent a random home location based on the mobile phone data and work cell is chosen based on a distance that is determined by the Levy-distribution model. The radiation model uses census data to distribute the home locations of agents and choose work locations based on the radiation model from Simini et al.
After testing, the mobile phone and radiation model worked much better than the random and levy-distribution models when predicting human movement. The two main parameters were the number of mosquitoes per human and the number of bites per mosquito. All of the models produced the main temporal trends well and for the spatial distribution analysis, the random model did not work, but the other models were able to predict key outbreak hot spots in the region.
This study proves that disease spread can exhibit localized patterns within cities, and that the simplistic representation of human movement within cities is outdated. This study proves the correlation between mobile phone data and human movement within a small area. This work can be applied to third world countries where human movement is on a larger scale.
Source 4: Integrating rapid risk mapping and mobile phone call record data for strategic malaria elimination planning
Tatem AJ, Huang Z, Narib C, Kumar U, Kandula D, Pindolia DK, et al. Integrating rapid risk mapping and mobile phone call record data for strategic malaria elimination planning. Malar J. 2014;13:52. doi: 10.1186/1475-2875-13-52.
The research focuses on targeting interventions using surveillance data, satellite imagery, and mobile phone data in conjunction with case-based risk maps. The goal is to improve elimination methods in third world countries. Achieving elimination can come from the creation of targeted risk maps but this must be matched with real-time human movement data to prevent transmission in a timely matter. Previously, data on human movement had an associated lag because it was limited to census data and travel surveys, but with the rise of mobile devices, real-time movement is possible.
Namibia has been scaling up its malaria prevention program to implement proactive deployment of vector control measures to high risk areas to prevent local transmission and onward spread. The model uses temporal sequences of phone tower locations to route user communications and convert them into movement trajectories. Integration of movement data with case-based risk maps provides a dynamic framework for understanding the connectivity between existing and potential malaria risk areas and defining ‘source’ and ‘sink’ regions.
For the methods, cases of malaria were confirmed using rapid diagnostic tests in the three highest transmission regions, Kavango, Omusati, and Caprivi. The data was taken from the January to May season. The Spatial covariate datasets represented rainfall, temperature, elevation, topographic wetness, vegetation, land cover, distance to water, infrastructure, and population density. The CDR data spanned a 12 month period with over 1.5 million subscribers. Over the 12 month period there were over nine billion communications from 1.19 million unique SIM cards, which represents 85% of the adult population of Namibia. To protect the privacy of the users, anonymized records aggregated to the level of cell towers were provided. The data entailed caller and receiver ID, the tower ID, and the date and time of the call/text.
The models mainly examined regional movement patterns, as opposed to movements within the city. The movements were calculated by examining the temporal sequence of calls and assigning a movement to a new area and time of the move when the area and call were changed. The CDR data “enabled construction of a weighted network of movements between each phone catchment area.” The models identified sink and source areas which represented which areas were exporters of the disease and importers, respectively.
Source 5: Prediction of epidemic disease dynamics using machine learning
Gupta Abhijit. (2019). Prediction of epidemic disease dynamics using machine learning. Medium.
This article was different than the others because it was not a formal research paper but a research project with an informal write-up. The author stated that the goal was to prevent disease transmission and plan interventions at a low cost. The two major goals were to minimize the financial burden and predict the next outbreak zone.
The author used geography, climate, population density, economic profile, weather, reported cases, vector agent occurrences, and proximity data to train the model on to predict the next location and date of the outbreak. The feature vectors are flexible which means that they can be applied to other diseases as well.
A problem with the data is that there is class imbalance, meaning that most areas had on-going outbreaks — 86% of the data contains positive zika cases.
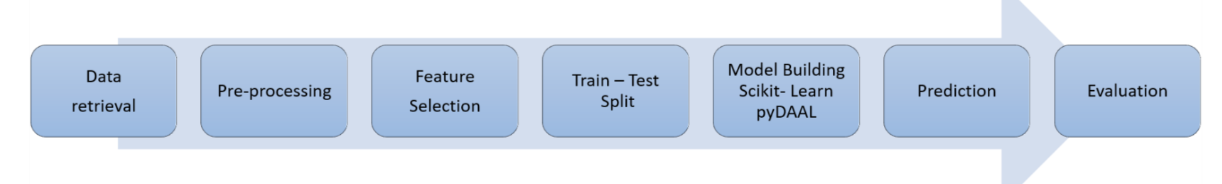
Feature selection was done with a random forest model which outputted how correlated one feature was to the outbreak location/time on a scale of zero to one. The training was done on 70% of the data and testing was done on the remaining 30%. The models used were ADABoost, XGBoost, SVM, Multi Layer Perceptron, and Logistic Regression where XGBoost proved to be the best with 95% accuracy.